Keyifleye Hatay LezzetleriSAĞLIK, KEYİF
SAĞLIK, KEYİF
VE ANNE ELİ
Keyifleye “Kaliteli yemeğin merkezi” hizmet amacıyla 2005 yılından beri sizlerle
Hemen Arayın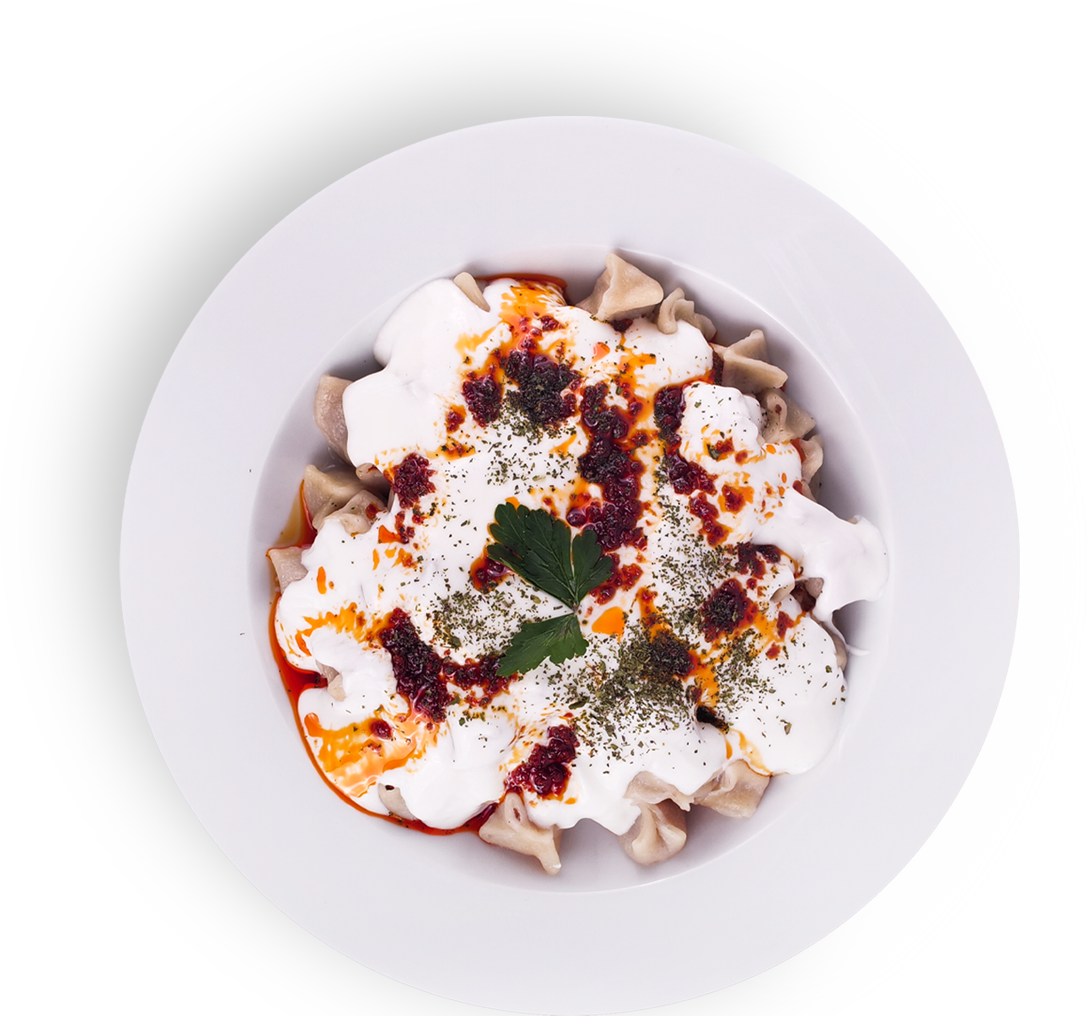


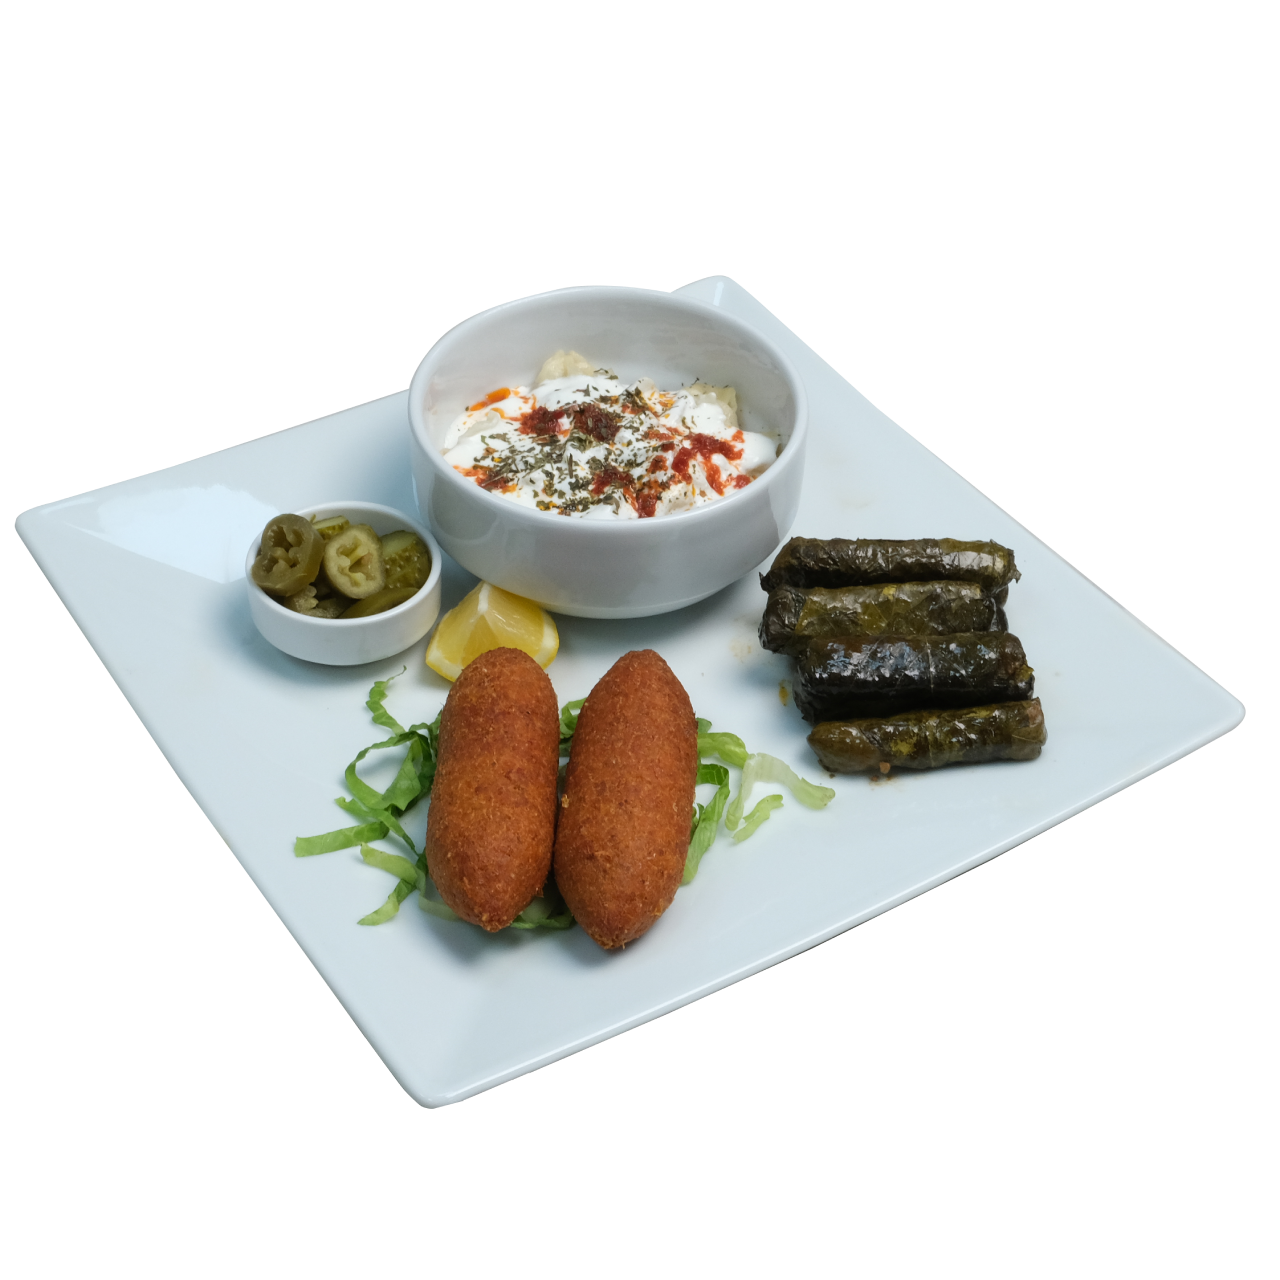
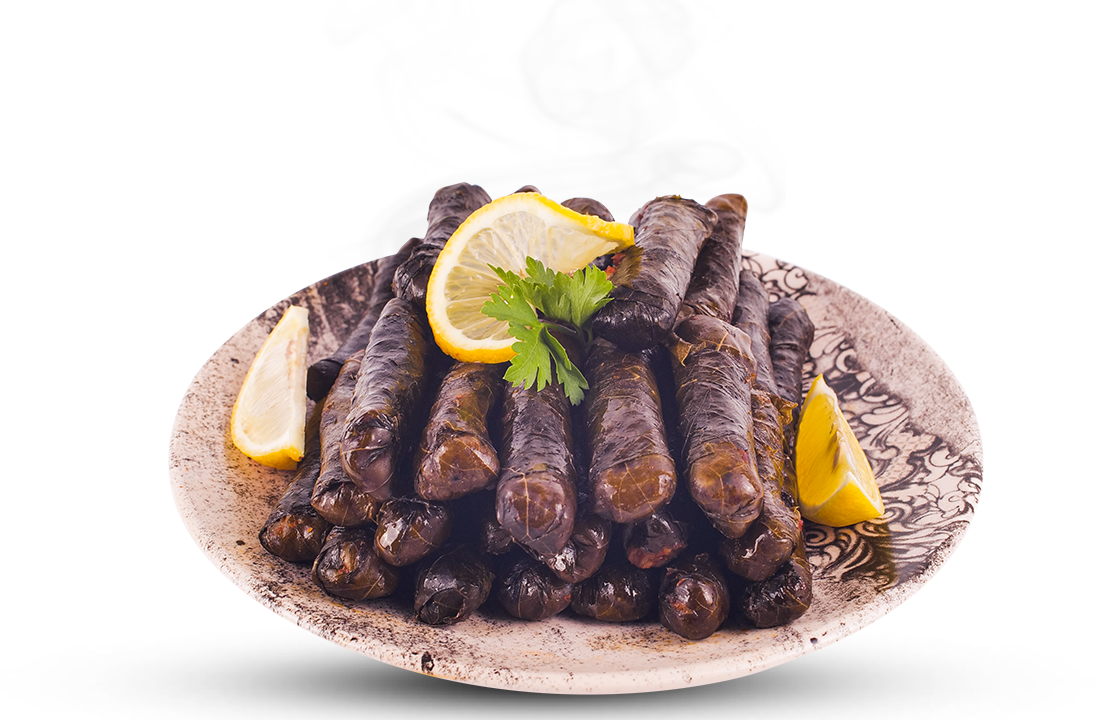
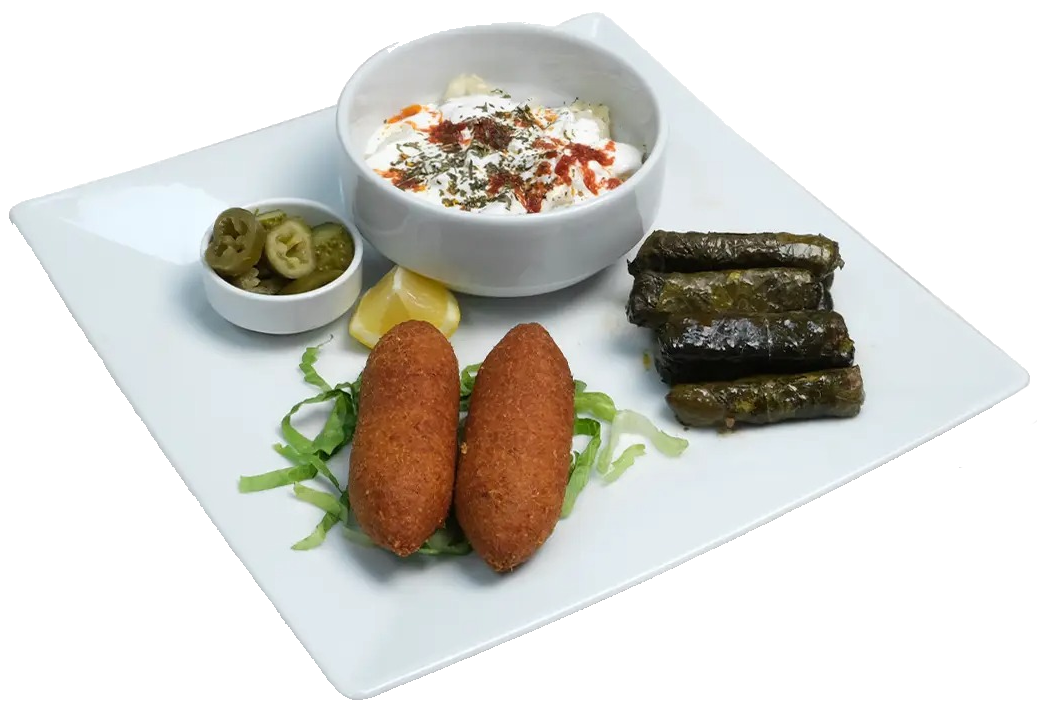
HATAY KÖMBESİSARMAİÇLİKÖFTEHATAY KÖMBESİSARMAİÇLİKÖFTEHATAY KÖMBESİSARMAİÇLİKÖFTE

Kaliteli
Sunum
Sunum
LEZZET, KALİTE SİZLER İÇİNHATAYIN İNCİSİ
HATAYIN İNCİSİ
SOFRALARIN VAZGEÇİLMEZİ
Marifetli, lezzet ustası aşçıları ile yemek konusunda hassas olduğunuz her konuyu dikkate alıyor, hizmetimizi bu doğrultuda gerçekleştiriyoruz 😊
Ev Yemekleri
Hızlı Servis

Hemen
Arayın
Arayın
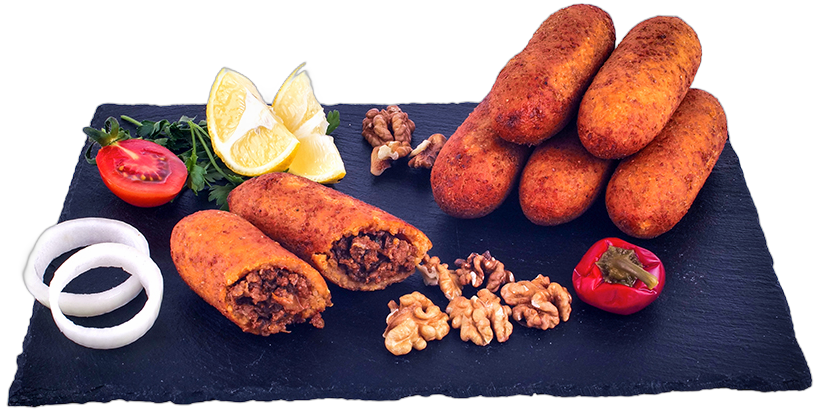


HATAY KÖMBESİSARMAİÇLİKÖFTEHATAY KÖMBESİSARMAİÇLİKÖFTEHATAY KÖMBESİSARMAİÇLİKÖFTE
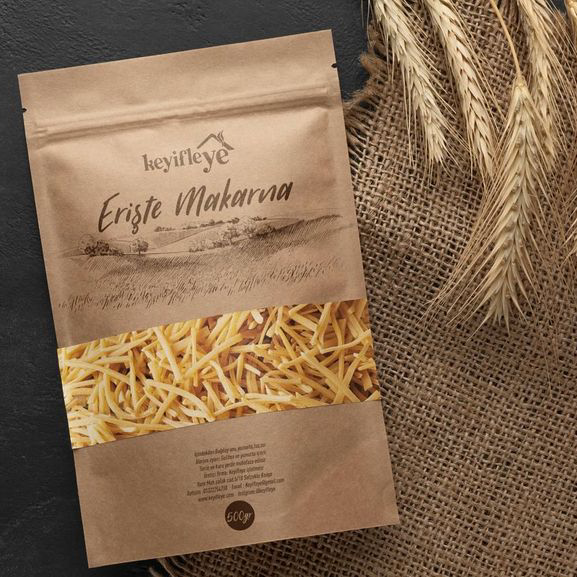
Anne Elinden
Erişte Makarna ♥️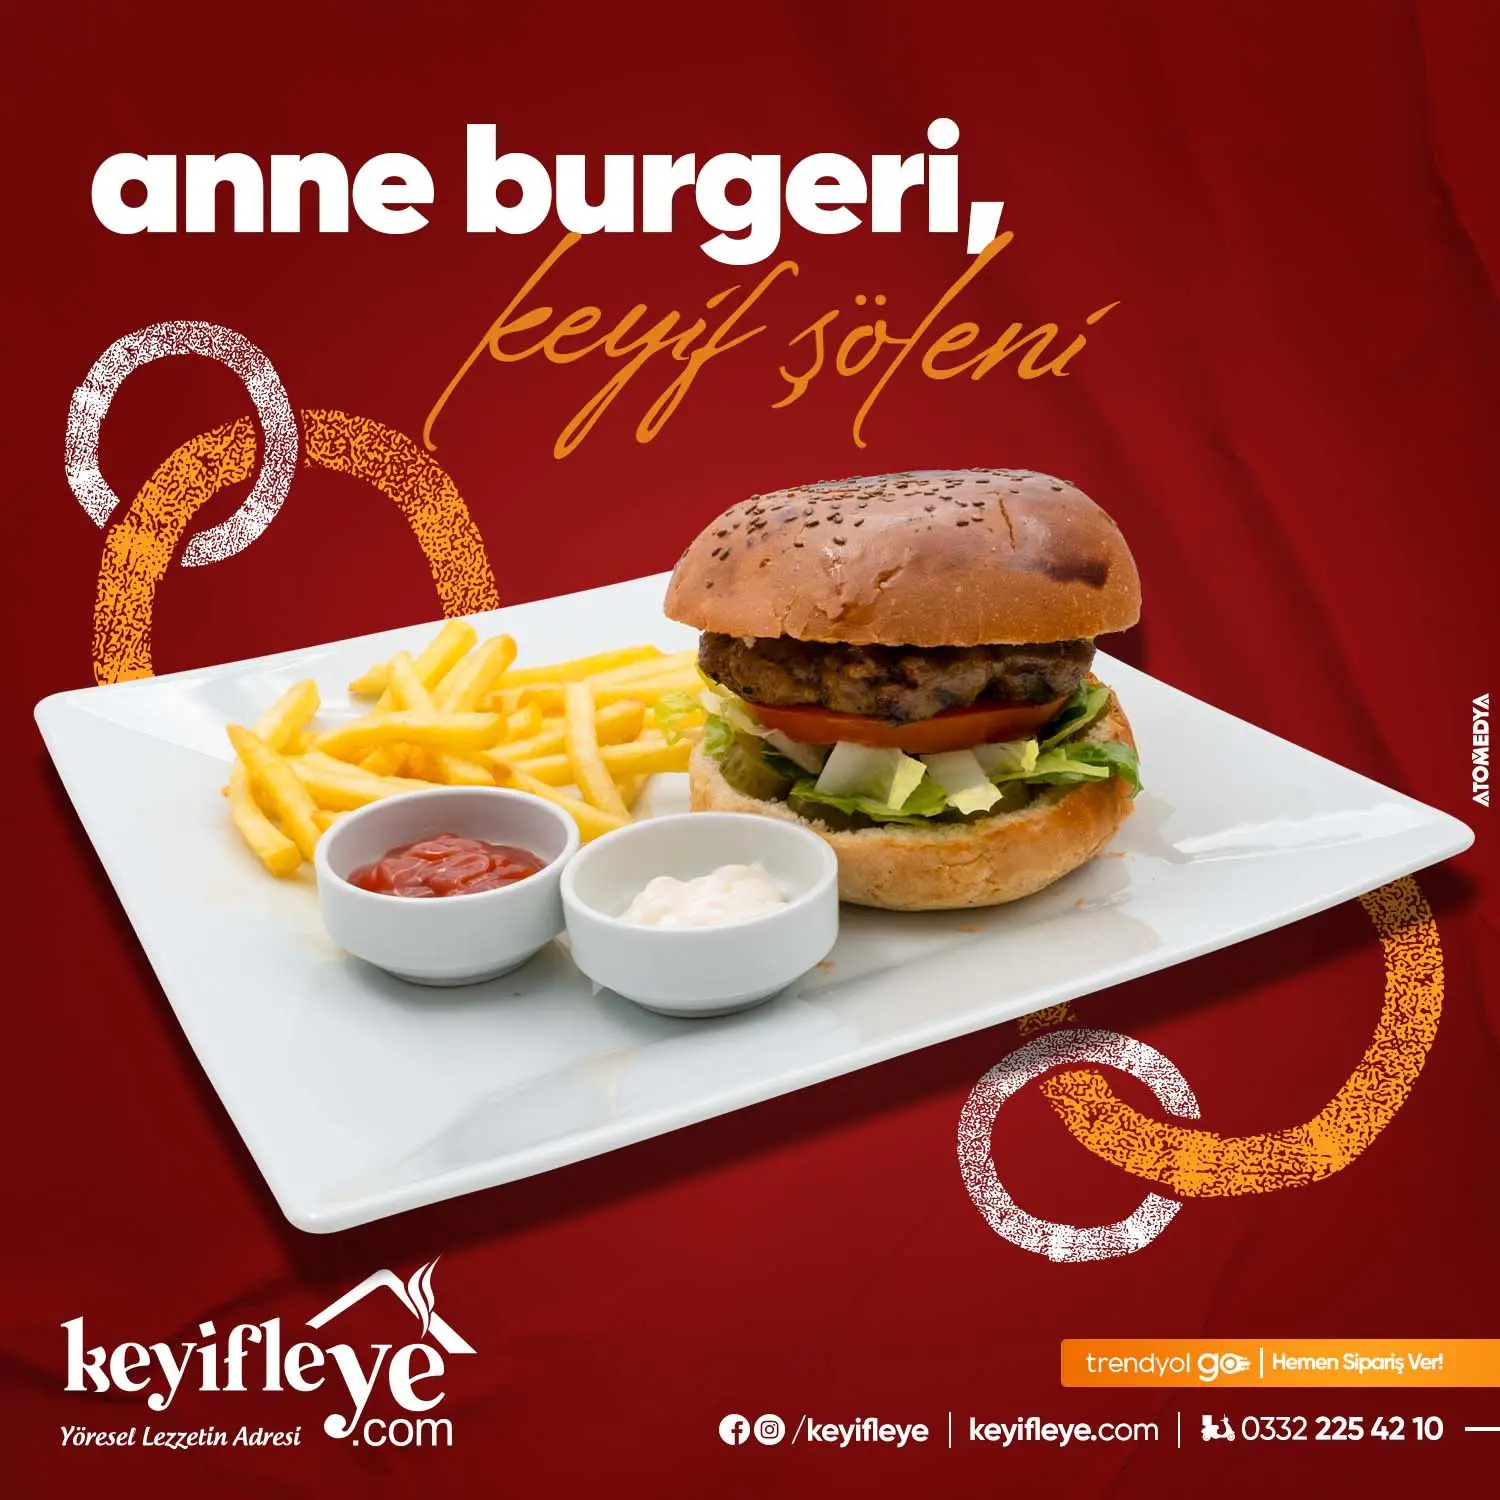
Günün Her Saati
Keyifleye Anne Burgeri ♥️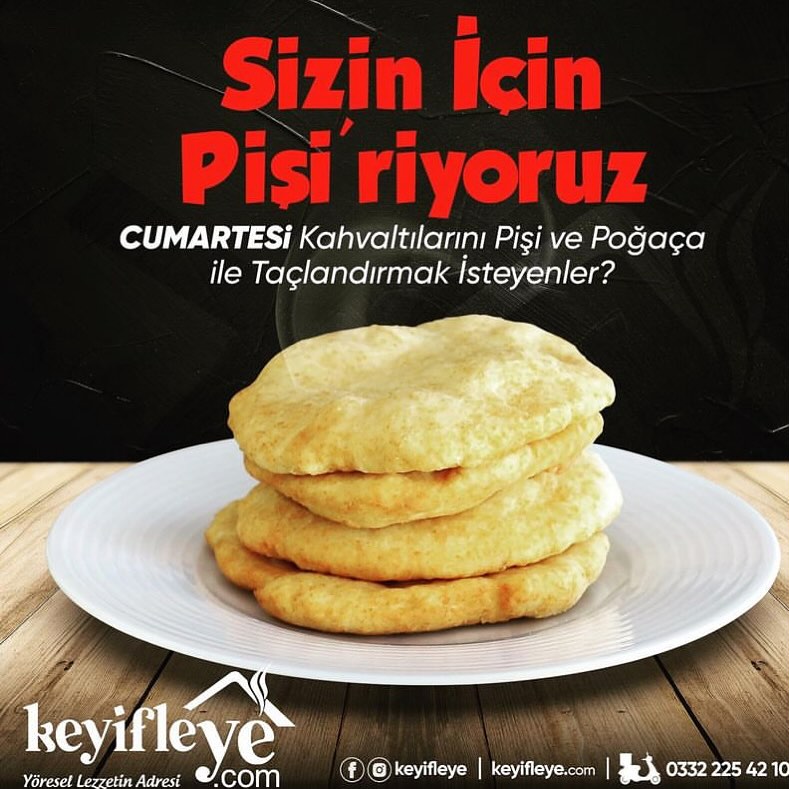
Her Cumartesi
Kahvaltılarınızı Pişi İle Süsleyin ✨İSTERSENİZ PAKET SERVİS, İSTERSENİZ Gel-AlMESAİM BİTTİ
HEMEN BİZİ ARAYIN MESAİM BİTTİ
EVDE YEMEK YOK 😢
paket
servis
servis